fbpx
Infographics

Infographics

  • Data Visualization
  • Informational infographics
  • Timeline infographics
  • Geographic infographics
  • Comparison Infographics
  • Process infographics

A great way to tell visual stories

What is an Infographic and How Can it Help Your Business?

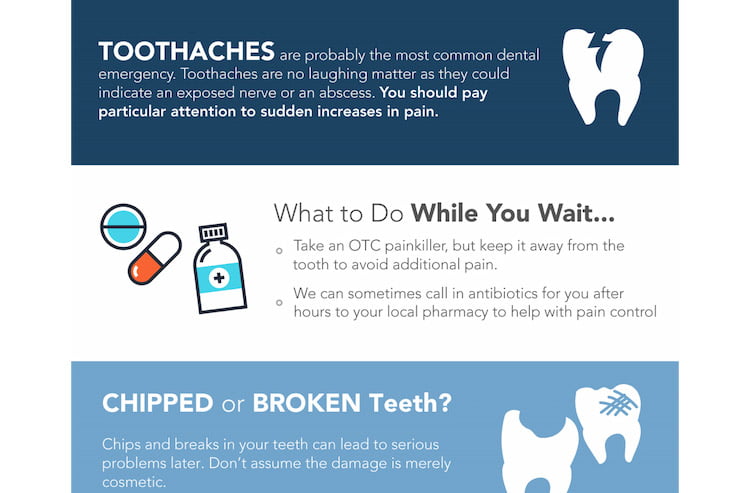
An infographic is simply a visual representation of data or information. Infographics use minimal text along with images and charts to help a reader better understand a concept or topic.

When infographics were introduced, marketers instantly recognized their value because they appeal to those with short attention spans who don’t want to read text-heavy content. They learned early on that infographics are useful for helping people understand and synthesize data, and that they are highly shareable.

But even though there’s a trend to newer types of visual content, like video, interactive experiences, and augmented reality, infographics are still very much in play. Successful companies like Netflix and the New York Times continue to use them to easily share information. The difference today is that the emphasis is on quality over quantity. When once it was acceptable to rapidly turn out infographics using stock images, marketers are now prioritizing design and originality.

65% of people are visual learners
60.8% of marketers agree visual content is absolutely necessary

Infographics Deliver Results

Intriguing visuals lead to more social shares

Social shares result in improved SEO and higher rankings on search results

Higher ranking on search engine results pages (SERPs) means more visitors to your website

Unique designs create brand awareness and recognition

As your social shares increase, your brand is perceived as an expert

When your brand is perceived as an expert, customer loyalty will increase

What Kind of Data Can You Represent with Infographics?

Data Visualizations

Data Visualizations

to visually represent complex data

The best way to represent data like statistics or survey results is in visual form. Data is often easier to grasp when it’s shown in a bar graph or pie chart. Even if readers can’t recall the precise numbers, they’ll be able to remember the relative position on a bar graph or the size of the pie piece.

Informational infographics

Informational infographics

to provide a high-level explanation of a topic

When you roll out an innovative product or a one-of-a-kind service, an infographic can help to introduce it in broad terms and outline its benefits. You may want to follow the visual with a lengthier explanation, but an infographic is an ideal way to get the most salient points across.

Timeline Infographics

Timeline Infographics

story that involves multiple events or changes over time

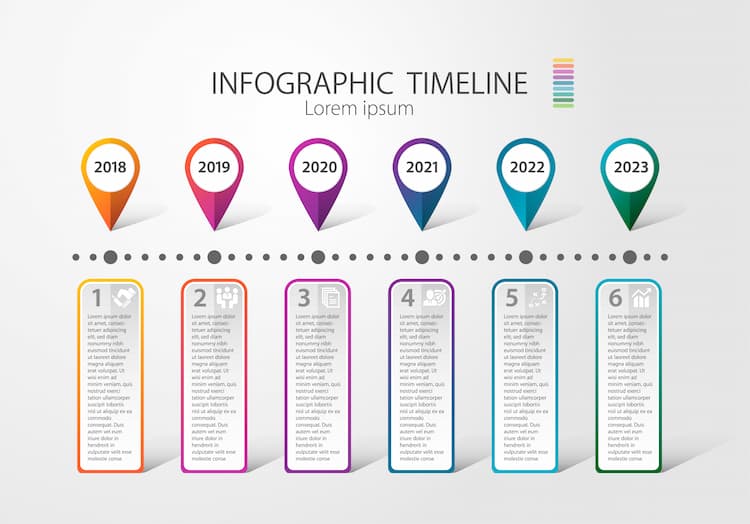
If you want to tell a story about how your company has changed over the years or how a product has evolved, a timeline infographic will give readers a clearer picture of how the events transpired, since people often use spatial cues to make sense of time.

Timelines can also give your customers a heads up on future products or events, giving them more time to plan their schedules or budget for an upgrade.

Map Infographics

Map Infographics

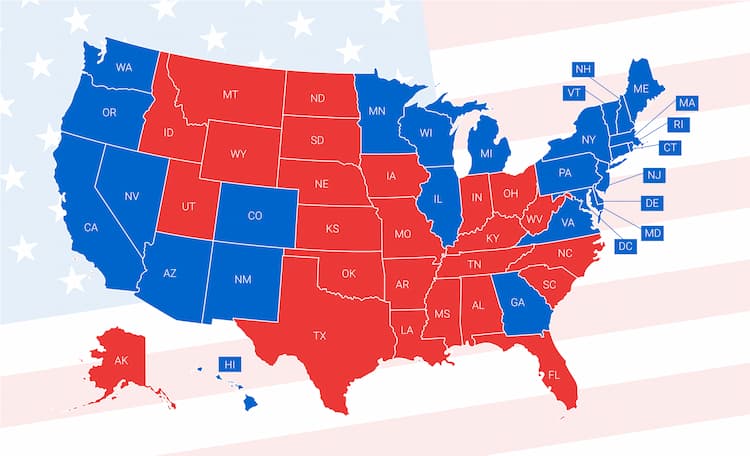
Whether you’re a business that serves a local community or a corporation that has a story to tell about its work in various geographic regions, maps can provide a lot of useful information to site visitors.

Real estate firms, logistics companies, and travel sites are perfect candidates for map graphics, but any company that wants to share information about its regional operations or activities could create a map infographic. Newer technologies are making it possible to use interactivity in maps, which could help position your business as forward-thinking.

Comparison Infographics

Comparison Infographics

compare two or more things

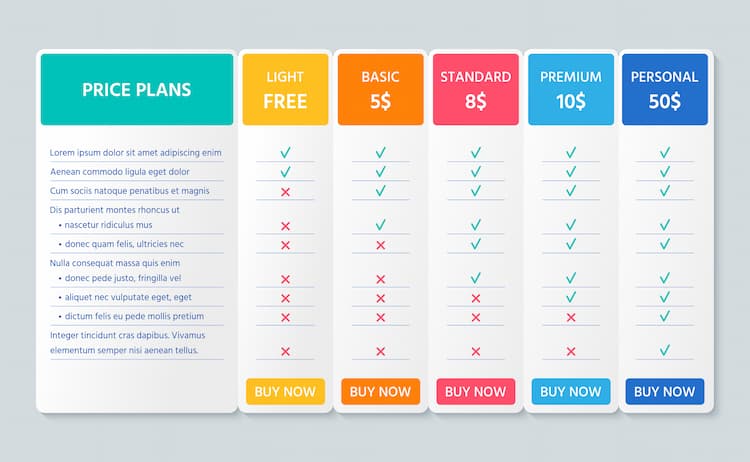
Comparison infographics are especially powerful when your company offers a clear advantage over a competitor. Using concisely-worded bullet points or short sentences in a side-by-side comparison, you can highlight your company’s strengths versus your rival’s on attributes like price, quality, functionality, and other valued features.

Process Infographics

Process Infographics

a step-by-step activity

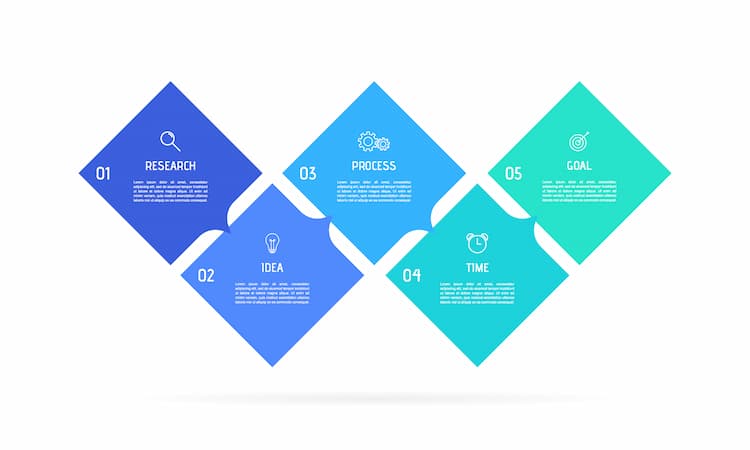
Process infographics detail a series of events, starting from the point of origination to completion. If you want to educate your customers about your business or to show them exactly how much care and preparation goes into making the end product, a visual graphic with color and illustrations will be better received than if the same information were included in a series of long paragraphs.

Lists

Lists

creative ways to lay out the points in your list

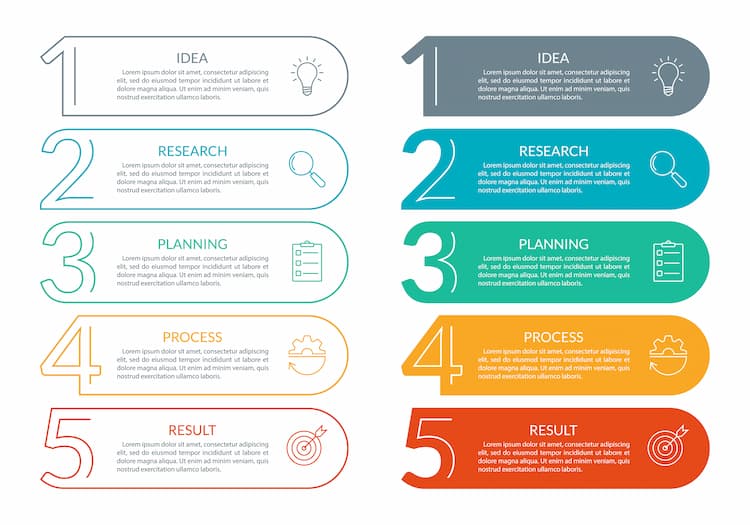
Do you want to present your product features in a way that’s easy to read? Maybe you’d like to display some of your testimonials or share tips for how to use or store your gadget. A list infographic allows you to highlight this type of information, set it apart from the text on the page, and make it stand out.

Ask us anything

Can infographics tell a strong story?

With imagery, color, and imaginative layouts at your disposal, infographics certainly include the visual elements to present a compelling story. But visuals can’t do all the work. Just like any good story, your infographic must:

  • Be based on a messaging strategy and a thorough understanding of your target audience
  • Should draw the reader in with captivating titles
  • Integrate the data into the tale
  • Present a logical structure the reader can follow
  • Highlight key takeaways
  • Finish with a sound conclusion

With infographics, the whole is indeed greater than the sum of its parts. But make sure the “whole” is based on a clear idea of what message you want to convey to your target audience.

How will my infographic be different from what’s already out there?

Infographics are designed with your brand in mind, and if done properly, readers will be able to clearly see it’s not cut and pasted from another source. Colors, design elements, and brand voice contribute to your unique aesthetic. But, more importantly, your infographic will include information that’s specific to your business. It’s your story and unlike anyone else’s.

Will infographics align with my existing content?

For infographics to be successful, they must align with existing content. In fact, every piece of content on your site should work together to build a larger story about your brand. Readers are perceptive to inauthenticity, and if an infographic doesn’t match with what they’re seeing elsewhere on your site, your brand will lose credibility. ADMEN understands the value of brand integrity for increasing site visitors and, ultimately, site customers.